
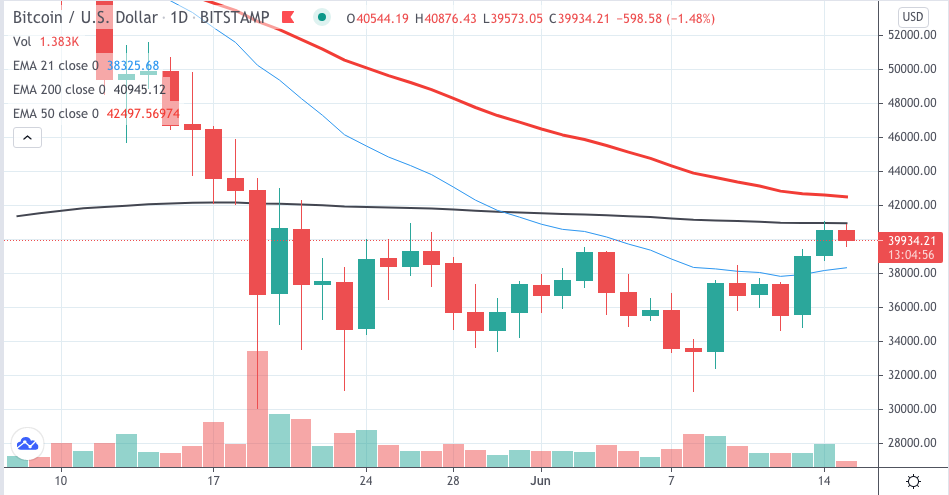
Bitcoin is gaining bullish momentum and reaching the 200 Moving Average on a Daily chart, represented by the black line in the image. This is a very important level which might be hard to break and a rejection and move to the downside can be expected.
On the other hand, if the daily candle closes above the 200 MA, it might send a bullish signal to the upside and increase bullish momentum. Moreover, if the daily candle closes above the 200 and the 50 MA represented by the red line, it would send a very strong bullish signal.
For the time being, however, it is still uncertain whether this level can be definitely broken. As seen on the chart, the 200 MA level is now being tested for the third time after the extremely bearish drop in price on the 19th of May when the 200 MA was broken to the downside.