
We all know about the meteoric rise of Bitcoin price in October 2017 and even though many of us hoped it was the beginning of a new and fairer world, the markets have proven once more that what goes up must eventually come down.

Unfortunately, many good people have lost a lot of money. Some have lost their entire life savings betting on it all on Bitcoin and hitting stop losses or simply cashing it all out to save at least a little bit before Christmas.
The financial markets are very unforgiving.
the reality is is that those who are still holding on to their Bitcoin investments are quite confused about how it all played out and dropped so low.
Should they hold longer, wait it out, and hope that Bitcoin will rise again or sell it all before the price drops completely to zero, as claimed by Nouriel Roubini in this article.
It could be argued that the ground-breaking implications of blockchain technology of which Bitcoin is the main representative, will affect our industries and governments so deeply that its value should be sky high.
Yet the markets are governed by many other forces than just a mere future potential.
What the markets are still searching for is a much greater acceptance of Bitcoin by users and regulatory bodies that can help to push this forward. The question is, however, do they want to? And the answer is probably not so much.
Bitcoin and its technology signals an end to the Status Quo and this challenge will always be met with great resistance by the powers that rule until it can be harnessed to their own advantage.
So looking at the price of Bitcoin today, we still don´t know who will take over in the end, the Bears or the Bulls.
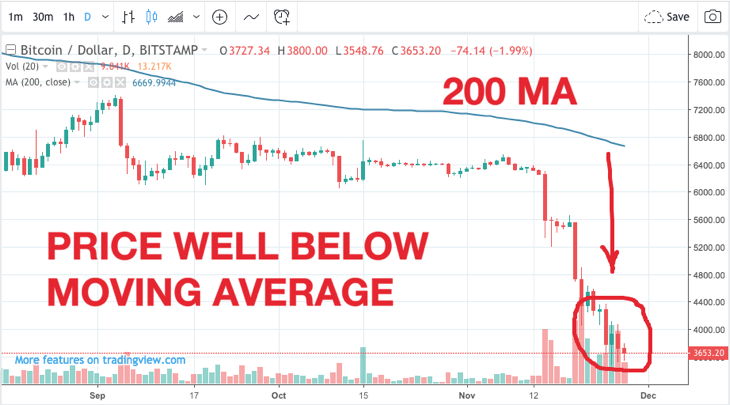
Let´s look at the Daily chart of BTCUSD. It clearly points to the dominance of a bear market. The 200 Moving Average, which has been a very good indicator of determining trends in the past across all asset classes is way above the price action. This indicates a strong bearish market.
Now let´t take a look at the Weekly chart of BTCUSD as it paints a slightly different picture. Here the price levels have still not broken below the 200 Moving Average line and Bitcoin remains in the bullish territory.
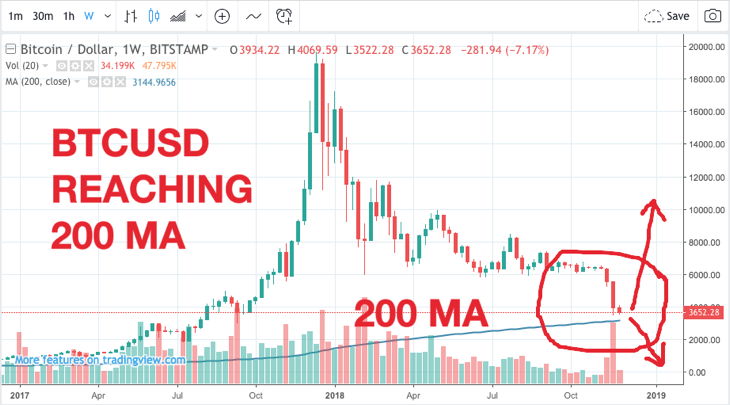
If the Bitcoin price breaks this 200 MA level it will signal a possible bear market that may last for months.
It´s important to understand that everything that happens on the weekly chart reflects a long term view.
Most media outlets and analysis focuses on 1-Hour or 4-Hour charts which is more for short term traders or investors.
Long term investors look at trends using weekly or even monthly charts.
On the weekly chart this drop in price seems like a very healthy and, what some technical analysts call, a much needed correction to the 200 MA level.
From June of 2011 to November 2011 the price of BTCUSD crashed from $32 to $2, that is 94% loss. The most recent Bitcoin crash is about 80%.

Be that as it may, it´s difficult to say definitely that this drop is over and that Bitcoin will hold near $3000. It might be forced down even lower. Time will tell soon.