
Bitcoin is now reaching new heights, again. Below is a Daily chart of BTCUSD which shows how the currency has advanced from June 2017 when it was near 2700 USD levels. After having reached new resistance at 7440 USD, Bitcoin now sits at 7100 USD, which is still quite an impressive jump within the span of only 4 months.

But as the daily chart shows us, the momentum might be turning south and we might be looking at the beginning of a correction that might bring the price back to the first support level of 6030 USD.
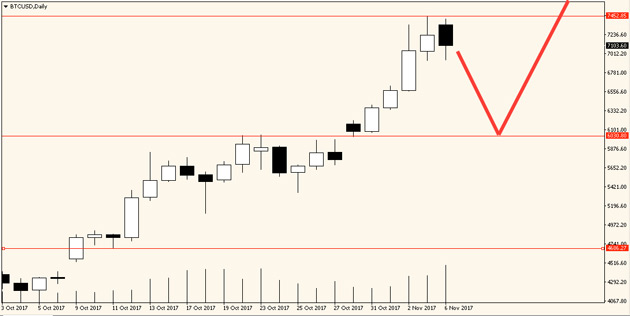
However, given Bitcoin’s momentum and increasing popularity, the price is very likely to keep going up after it hits this support level.