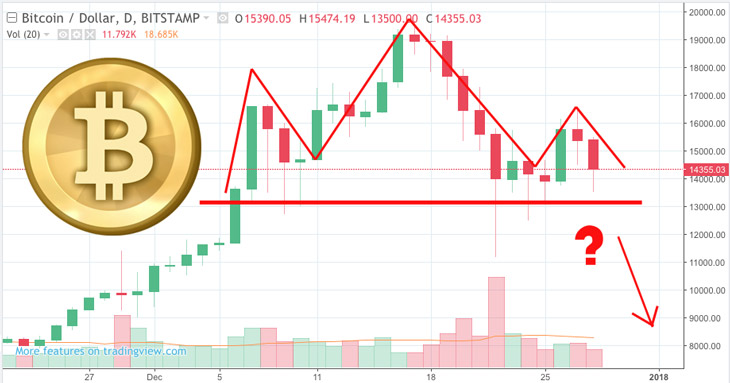
Looking at the BTCUSD Daily chart we can see that there is a head-and-shoulders pattern developing which could be a sign off an impending sell off.
Head and shoulder pattern with a crossed neckline is usually a strong indication of a trend reversal that can last weeks or months.

Currently the price is still above the region of the neckline (line seen on the chart) but if the price closes below it, Bitcoin’s phenomenal uptrend might go into a reversal. Then it can drop much lower.
Here is the same head and shoulders pattern on the 4 Hour chart

If the price of Bitcoin goes lower, it’s likely that there is going to be some resistance near $11,000, as this was the lowest level of the most recent correction.
Technical price analysis is all about detecting specific price patterns and trends, but nothing is 100 percent certain.
Bitcoin price might also bounce off near the neckline and go up to test $20,000 again.
Cryptocurrency markets are quite unpredictable, especially Bitcoin.
Note. This post is for educational and entertainment use only and it is not an invitation to trade. Trading involves high risk to your capital.
