
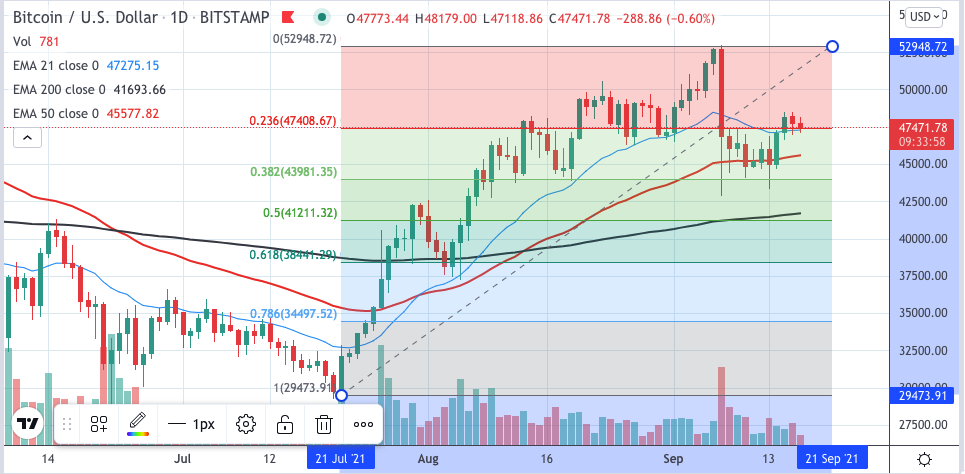
As suggested in previous post, the price of Bitcoin surpassed $45,000 and now is testing this level as support. This daily chart shows how this level is marked by the 50 Exponential Moving Average indicator.
The 50 EMA is above the 200 EMA indicating the classic Golden Cross, which gives us a bullish outlook.
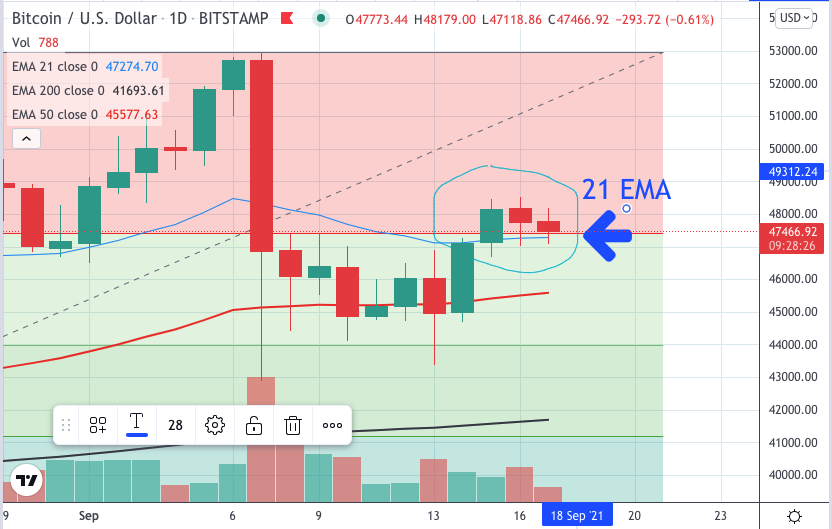
At this moment, Bitcoin has bounced off the 50 EMA, crossed the short-term 21 EMA to the upside and now it is retesting this level.
This is also the level of the 0.23% Fibonacci retracement, taken from the start of the bullish run back on the 21 of July 2021 (as seen in the chart above).
We can also see how the price of Bitcoin tested the 0.38% Fibonacci retracement on the 7th and the 13th of September.
As the sentiment is generally bullish, it is reasonable to expect that the price will move up. It seems Bitcoin is destined to revisit it’s all time high.
There are many notable analysts and investment managers who recently announced that in their opinion the price of Bitcoin will reach $100,000 at the end of 2021.
Could that be true?
I really don’t know, but watching closely the rise of Solana for the last couple of weeks, I think anything is possible in the crypto world.
Let me know what you think.